How Lifestyle Changes in Large Cities

Happy 2026. I was out of town two weeks ago, and so there was no post. I apologize for neglecting to mention last time that I would be gone. We’ll kick off the year with a look at some aspects of how people live on a day-to-day basis and how that varies with city size. We’ll focus on two elements today: walking speed by city size and cell phone usage. As usual, this research is supported by a Giving Coefficient Living Literature Review Grant, but the work is my own and does not represent Giving Coefficient’s views.
City Size and Walking Speed
We’ll start with a famous paper, Bornstein and Bornstein (1976), which finds a linear relationship between the log of city size and average walking speed.
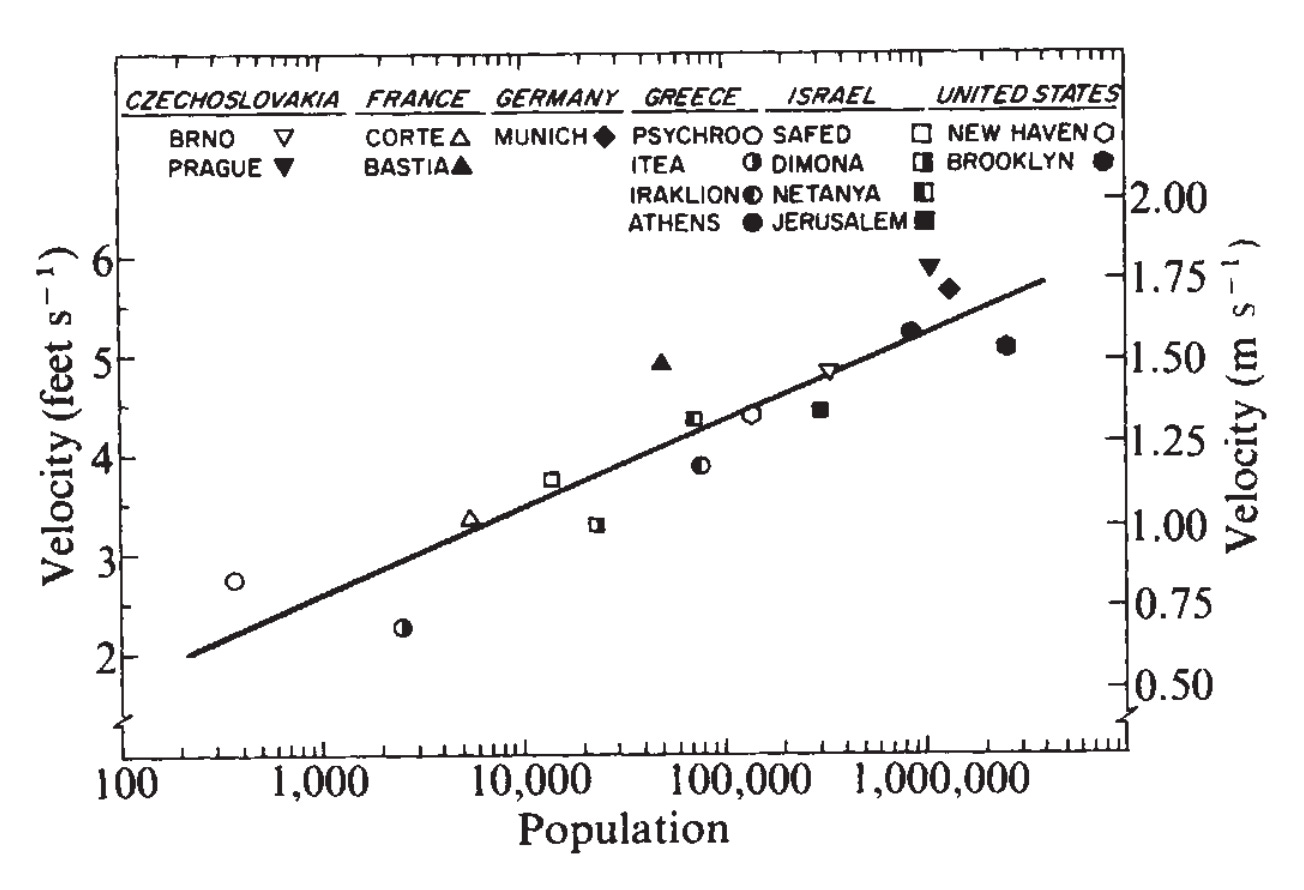
Their methodology is nice and simple. They went to 15 cities around the world and directly measured walking speed. They then performed a regression between city size and walking speed to produce the above chart. The relationship is significant at p=0.001, a value that most social science researchers would be envious of. And so, that’s that for city size and walking speed, right? Well no, of course it’s not so simple.
Reflecting its time, Bornstein and Bornstein (1976) expresses anxiety about population growth. The opening sentence is,
THE specific effects of population pressure on the quality of everyday life should be of pressing social and policy concern; and although population studies have proliferated in the behavioural sciences, research has focused primarily on fertility-related behaviours.
Citing Freedman (1973), their interpretation of the result is that high walking speed is an adaptation to the stress of crowding in large cities. Such an interpretation does not directly follow from the data, however.
Wirtz and Ries (1992) dispute the findings of Bornstein and Bornstein (1976), arguing that these authors made the rookie mistake of failing to control for demographic factors. Larger cities tend to have disproportionate populations of young people without families, who typically walk faster. Wirtz and Ries (1992) argue that when demographics are controlled for, the city size-walking speed link disappears. Witrz and Ries use the same methodology on 14 cities in Europe that Bornstein and Bornstein use. The only major difference between the two papers is that Wirtz and Ries interpret the results differently: higher walking speed in large cities is due to a different demographic composition rather than the psychological pressures of density.
Moving away of walking speed based entirely on city size, let us consider Schmitt and Atzwanger (1995), a study that got featured in Improbable Research. They measured walking speed and interviewed some people to find out their socioeconomic status (SES), which is defined as a composite measure of prestige of occupation, income, and education. They find a statistically significant correlation between SES and walking speed for men but not for women (though women have a weak correlation). The authors’ explanation is rooted in sociobiology: since men have to compete for mates and not vice versa, men with higher status are more compelled to signal status by walking more quickly. I have to say that I don’t find the explanation to be very convincing, but it may be worth keeping when discussing correlations between GDP and walking speed.
Next, let us consider Levine and Norenzayan (1999), who introduce several more innovations into the discussion. Following some earlier authors, they broaden the question of walking speed into “pace of life”, which is represented by three metrics: walking speed, work speed for postal clerks, and accuracy of bank clocks. These metrics correlate well with each other (Levine and Barlett 1984) and, as Levine and Norenzayan suggest, serve as a good proxy for pace of life. Concerned about the unsystematic manner in which cities are chosen for most previous studies, Levine and Norenzayan choose the largest cities in 31 countries for comparison. They furthermore consider several city features that might predict pace of life: gross domestic product, climate (hot or cold), individualistic vs. collectivist cultures, and city size. Most of these metrics are derived from fairly standard sources, though the individualism/collectivism metric is more complicated and discussed in the paper. The three metrics for pace of life are derived from readily available observations and are aggregated into a single metric.
Levine and Norenzayan (1999) find, as hypothesized, that pace of life correlates with GDP, with colder climates, and with more individualistic cultures.
Levine and Norenzayan (1999) also tackle questions related to well-being. I will admit at the outset that the phrase “subjective well-being” makes me cringe for reasons that might make a good post in the future, and whether a faster pace of life is a good thing or not is going to be a mostly personal question. But we can measure a few aspects of it. The authors find that there is a statistically significant correlation between pace of life and coronary heart disease, which is understood to be influenced by chronic stress. They also find that smoking rates correlate with pace of life, and they posit that smoking is a response to the stress induced by pace of life.
It may be surprising, then, that according to Levine and Norenzayan (1999), subjective well-being (SWB) also positively correlates with pace of life. Here, SWB is derived from Veenhoven (1993), which determines SWB from surveys of how happy people are. The interpretation of Levine and Norenzayan (1999) is that SWB correlates with GDP (see Diener, Diener, and Diener 1995), and this effect is more important than the negative impacts of smoking and heart disease. A more plausible interpretation in my mind is that SWB is not actually a useful metric. But it’s what we have here.
Finnis and Walton (2008) reject the idea that walking speed is in fact an indicator of pace of life, and they discuss walking speed in terms of the built environment. They measure average speed in several locations in New Zealand. They find some obvious things, like walking speed tends to be slower for pedestrians with baggage and depends on the type of shoes and the slope of the terrain. They find that, once the more obvious factors are considered, that there is actually a slight negative correlation between city size and walking speed. Unfortunately, the paper does not deliver on its promise of analyzing how build environment characteristics influence walking speed, but given constraints such as Marchetti’s constant, they argue that a high walking speed helps promote car-free environments.
Franěk (2012) considers the impact of two built environment metrics—the presence of vegetation and the busyness of roads—on walking speed, and he finds that walking speed tends to be higher when vegetation is lacking and when roads are more busy. His interpretation is that busy roads and a lack of vegetation create stress for pedestrians and induce them to walk more quickly.
Finally, Shen and Yen (2025) conduct a meta-analysis of walking speed studies, each of which analyzes walking speed in terms of several variables (though not every study uses every variable). They then cluster the results using DBSCAN, a popular clustering algorithm in unsupervised machine learning. They find three clusters with a handful of outlier points. They find the demographic composition of a city and the weather to be highly significant factors, neither of which should be a surprise.
There are many other papers that I haven’t reviewed here, but I think that these papers give a good sampling of the development of our ideas of walking speed and city size. The idea that walking speed rises with city size is one of those ideas that gets bandied about a lot fairly uncritically; see for instance this brief Planetizen write-up. But why people walk faster in larger cities—and even the extent to which they do—is not so simple. The research has come a long way since Bornstein and Bornstein (1976), yet that study still seems to dominate.
Cell Phone Usage
Bettencourt (2013), and other works by the same author, are among the most important works in economic geography, and one of the issues that this paper discusses is cell phone usage. I discussed this paper early in the Scaling project. To reiterate the earlier post, socioeconomic quantities, such as incomes, tend to increase with city size in an allometric fashion. This means that if a city’s population is N, then the paper’s theory predicts that socioeconomics quantities should grow like N^(7.6) = N^1.1666… . For actual phone usage, I wrote last time that,
This paper does not consider economic output directly, but rather it examines social interaction, for which mobile phone connectivity is taken to be a good proxy. They find that in Portugal, the 92-day call volume scales with the 1.10 (1.08-1.11) power of city size, whereas in the United Kingdom, the 31-day call volume scales with the 1.10 (1.07-1.14) power of city size. There are various other metrics related to the call data set, all of which show similar scaling properties. One thing especially interesting about the paper is that they find that, for two of a given person’s contacts, the probability that they are themselves connected is independent of city size, which challenges the popular notion that larger cities are more atomizing than small towns.
Sapienza et al. (2023) consider a data set of 500,000 cell phone calls across 22 countries. They find that typical cell phone usage in urban areas is 175 minutes per day and 152 minutes in rural areas. Controlling for demographics—something that we saw from Bornstein and Bornstein (1976) is necessary—urban dwellers use their phones 5.12% more than their rural counterparts, rather than 15.1% more. This gap is still statistically significant. In a few countries, though, rural residents use their phones more than urban residents. They use their phones in different ways too.
Individuals in urban areas allocate a larger fraction of time to apps categorized as Maps and Navigation (+150.0%), News (+38.7%), Travel and Local (+28.7%), Music (+20.0%), Business (+19.3%), Productivity (+13.7%), Communication (+7.2%), and Browsing (+4.9%), with 𝑝 ≪10−20. Further, we focus on the total amount of smartphone time by category of apps. Here, we find that not only the fraction of time but also the total time is greater for rural individuals with respect to categories such as Weather (+26.1%), Shopping (+14.1%), Social (+7.5%), and Game (+5.8%).
One of the gotchas for these kinds of results in demographics; we see that at least to some extent, the demographics that use their phones more tend to live in cities. Another problem is self-selection. Do cities really cause people to use their phones more? Maybe it is the case instead that the kinds of people who use their phones more prefer to move to cities. To address this question, the authors look at how phone usage changes after a move. They find (bold added by me),
In particular, in the period included between 14 and 36 weeks following the move, the median daily phone usage for individuals moving from urban to rural areas is 14.7% (90% CI: 14.1%, 15.5%) lower than baseline; for individuals moving from urban to other urban areas it is 5.5% (90% CI: 5.4%, 5.6%) lower than baseline; for individuals moving from rural to urban areas it is 11.7% (90% CI: 10.5%, 12.9%) higher than baseline; and for individuals moving from rural to other rural areas is 6.1% (90% CI: 5.3%, 6.7%) lower than baseline (see Fig. 4a and b). Note that, by design, the median daily phone usage for all groups is consistent with baseline in the period included between 36 and 14 weeks preceding the move.
In other words, in most cases phone usage goes down after a move, but in moving from a rural to an urban area, usage goes up. This suggests that the differences are actually induced by the environment and not merely self-selection.
At first, I found these results counterintuitive. I would have thought that rural people would use their phones more because face-to-face interaction is scarcer. In economics-speak, face-to-face interaction and cell phone interaction may be complements rather than substitutes. This would also explain why phone usage drops after an urban-to-urban or a rural-to-rural move.
Conclusion
People anecdotally remark that the pace of life tends to be faster in the city. That appears to be true, whether pace of life is measured by walking speed, phone usage, or other things. It is not entirely clear why this is the case. For walking speed in particular, we explored several hypotheses. Maybe it’s because large cities are stressful, or men are signaling status, or the built environment is more conducive to fast walking, or something else.
Whether this is a good thing is subjective. I briefly touched on well-being aspects above, and I am planning on a more thorough treatment of city size and mental health in the next post.
Quick Hits
In my last post, I cited Angel et al. (2010) and their result that urban density has generally been decreasing all over the world in the 20th century. Those results are outdated; a reader pointed out that in the United States, urban density has increased somewhat in the 21st century, though not nearly enough to offset the decline in the previous century. Analysis of the 2020 Census finds that in the U.S. (excluding territories), urban density increased by 9% between 2010 and 2020. It will be interesting to see if this trend remains durable with the widespread adoption of autonomous vehicles.